How to Read a Nautical Chart: A Beginner's Guide to Symbols, Depths, and Hazards
A paper chart packs a coastline, a harbour, a shoal field and a lighthouse into something the size of a tea towel, and every mark on it means something specific. That density is why new boaters tend to glance at one, feel vaguely out of their depth, and go back to the screen. Give it an hour instead. A dozen conventions do most of the work, and once you can read them, the chart becomes the most useful thing on board — the only document that shows you what the water is hiding.
First, the Frame: Scale, Direction and Distance
Scale tells you what a chart is for. A harbour chart, large scale and covering a few miles, draws individual moorings, slipways and the exact shape of a single buoy. A passage chart, small scale and covering a hundred miles or more, drops all of that to show the coast as a line and the sea as a field of numbers. Carry both: the small-scale chart plans the day, the large-scale chart gets you into the marina. The title block names the scale and, crucially, the units used for soundings. Some charts work in metres, some in feet, some in fathoms. Check before you read a single number.
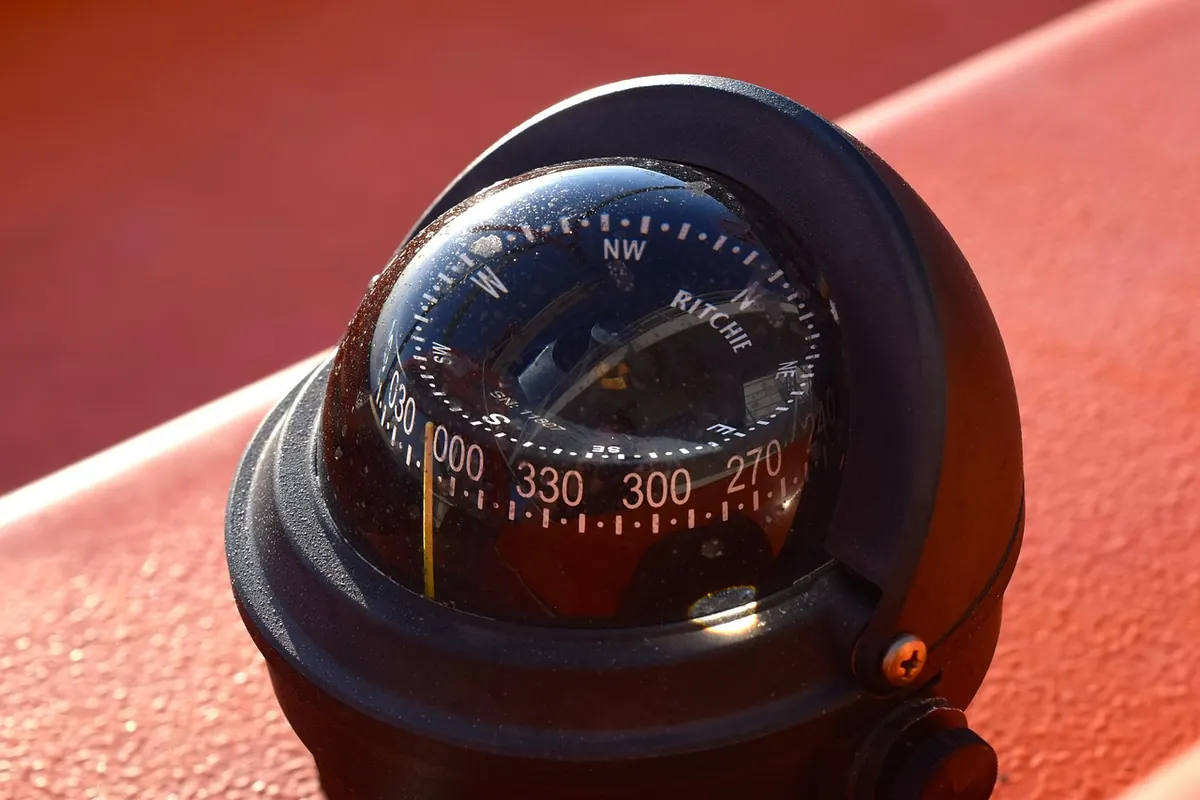
Direction comes from the compass rose printed on the chart. The outer ring reads true, the inner ring magnetic, and a note alongside gives local variation with an annual rate of change. If your plotting is in true and your compass reads magnetic, that difference has to be applied somewhere; decide where and stay consistent. On most small boats the sane habit is to plot in true and convert to a steering course at the helm.
Distance is measured on the latitude scale up the side of the chart, where one minute of latitude equals one nautical mile. Never measure along the top or bottom edge: on a Mercator chart the longitude scale stretches as you move away from the equator, and your mile quietly becomes a lie. Dividers or the edge of a scrap of paper do the job.
Symbols: Buoys, Lights and Marks
Buoyage follows the IALA system, and the system has two flavours. In Region A — most of Europe, Africa, Asia and Australasia — red marks the port side of a channel and green the starboard side when entering from seaward. In Region B, which covers the Americas, Japan, Korea and the Philippines, the colours are swapped. The chart itself will not usually shout about which region you are in, so confirm it before you trust colour memory.
Cardinal marks are black and yellow, topped with two cones, and tell you where the safe water is relative to the mark: north, east, south or west. Safe water marks, isolated danger marks, special marks and lateral marks fill in the rest of the vocabulary.
Lights carry a symbol for position and colour, then text giving character, period and range. Learn to read the abbreviations and the chart stops being cryptic:
- Fl — flashing, with a single flash at regular intervals
- Fl(3) — a group of three flashes, as in "Fl(3) R 10s": three red flashes every ten seconds
- Oc — occulting, light on for longer than it is off
- Iso — isophase, equal periods of light and dark
- Q and VQ — quick and very quick, often marking a turn or a hazard
- Mo(K) — a Morse letter, occasionally used for identification
Sector lights are worth a second look: a coloured sector drawn across the chart, often green or red, marks the arc in which the light is visible or where it leads you. Transits and leading lines work the same way, and they will get you into a strange harbour more reliably than a screen.
Treat the published range as an optimistic figure for clear weather. Rain, haze and a low eye height cut it sharply, so plan the last few miles to have an alternative.
Depths: Soundings, Contours and Tide
Every number printed on the water is a sounding, measured from chart datum rather than from the surface. A figure like 5 with a small 3 beside it means 5.3 metres. Charts in feet use the same convention with a subscript in inches or a fraction.
Chart datum sits close to the lowest water normally expected — lowest astronomical tide in many places, mean lower low water in the United States. So the real depth is usually more than the printed number. That is the safety margin built into the chart, and it is not a promise. Sustained offshore winds, low pressure and a big spring tide can push water well below datum, which is why you always add your own allowance on top.
Contour lines join points of equal depth and are faster to read than individual numbers. The 10 m line tells you at a glance how far you can run inshore; the shallow side is usually tinted a paler blue. Underlined numbers mark drying heights: rocks and banks that uncover at low water, expressed as their height above chart datum. A bank drying 0.8 m is a different proposition from one drying 2 m.
Before you leave, decide your personal no-go contour. For a boat drawing 1.8 m, with a metre of swell allowance and half a metre of caution, nothing inside the 5 m line is fair game. On a plotter, the safety depth and safety contour settings do exactly this — but they only work if somebody has entered the numbers.
Hazards and the Marks That Warn You
Wrecks are drawn differently according to how much of them is left above water. A wreck considered dangerous to surface navigation is marked as such, often with a circle or a note, because there may be little or nothing visible at any state of tide. A wreck with masts showing is drawn with its masts and treated as an obstruction you can see.
Rocks come in three useful forms: rocks that always show, rocks awash at chart datum, and rocks that cover and uncover, with the depth printed and underlined. Isolated dangers in otherwise deep water deserve particular respect, since there is no shallow water around them to remind you they exist.
Then there are the marks that have nothing to do with depth. Submarine cables and pipelines appear as dashed or wavy magenta lines, frequently with a small anchor symbol and a note about anchoring. Foul ground, obstructions and tide rips or overfalls are marked in their own shorthand — and in a small boat, an overfall in wind against tide will ruin your afternoon long before the depth does. Boundaries, traffic separation schemes, precautionary areas and military exercise zones are usually magenta, and they are instructions rather than decorations.
Finally, keep vertical clearance separate from depth. A bridge showing 12 m of air draft and a channel showing 12 m of water are two entirely different conversations, and only one of them is about your keel.
Read the Small Print (It Is Not Small)
Charts carry a lot of text, and almost none of it is filler. The edition date and the small corrections block tell you how current the sheet is; a chart that has sat in a locker for four years without a Notices to Mariners update is a liability, not an aid. The source data diagram shows which parts of the survey are modern and which were sounded by lead line before your grandparents were born, which explains why some areas look confident and others look approximate. And the horizontal datum note matters the moment you type coordinates into a GPS: a position lifted from a chart on an older local datum can land you a long way from where you meant to be.
Notes panels also carry tidal stream arrows and rates, local regulations, and the cautionary remarks that never made it onto the main chart face. Read them at the berth, not at the harbour entrance.
Planning a Route on Paper
Paper planning is quick once you have a routine. It also forces you to look at the whole passage rather than the next waypoint.
- Mark departure and arrival, then look at the whole sheet before drawing anything. Note the headlands, the obvious offshore dangers and the harbours of refuge.
- Draw the intended track, then look either side of it. A corridor a mile wide each way is realistic; a single line is not.
- Check the depth under each leg at the worst tide you expect, add your margin, and adjust the track if any leg falls inside your no-go contour.
- List the lights you plan to use, note their character, range and arcs, and work out roughly when each should appear.
- Mark a safety bearing off each significant headland, so a single compass check tells you which side of trouble you are on.
- Write the last mile in plain words: leading marks, transits, expected soundings, and the fallback if the wind or visibility changes.
Before You Cast Off: A Two-Minute Chart Check
Four questions, every time. Is this the current edition, and has it been corrected? What units are the soundings in, and what is my no-go contour? Which hazards sit within a mile of my track, and what marks them? If the electronics went dark now, could I get home on paper?
Charts reward the habit of looking at them before you need them. Fold one open with your coffee the night before a passage, trace the route with a finger, and let the shapes settle in your memory. By the time you are actually out there, half the work is already done — and the water will feel a good deal less mysterious than it looked from the pontoon.
Photo: cocoparisienne / Pixabay